| cols_merge_n_pct {gt} | R Documentation |
Merge two columns to combine counts and percentages
Description
cols_merge_n_pct() is a specialized variant of cols_merge(),
It operates by taking two columns that constitute both a count (col_n) and
a fraction of the total population (col_pct) and merges them into a single
column. What results is a column containing both counts and their associated
percentages (e.g., 12 (23.2%)). The column specified in col_pct is
dropped from the output table.
Usage
cols_merge_n_pct(data, col_n, col_pct, rows = everything(), autohide = TRUE)
Arguments
data |
The gt table data object
This is the gt table object that is commonly created through use of the
|
col_n |
Column to target for counts
The column that contains values for the count component. While select
helper functions such as |
col_pct |
Column to target for percentages
The column that contains values for the percentage component. While select
helper functions such as |
rows |
Rows to target
In conjunction with |
autohide |
Automatic hiding of the
An option to automatically hide the column specified as |
Value
An object of class gt_tbl.
Comparison with other column-merging functions
This function could be somewhat replicated using cols_merge(), however,
cols_merge_n_pct() employs the following specialized semantics for NA
and zero-value handling:
-
NAs incol_nresult in missing values for the merged column (e.g.,NA+10.2%=NA) -
NAs incol_pct(but notcol_n) result in base values only for the merged column (e.g.,13+NA=13) -
NAs bothcol_nandcol_pctresult in missing values for the merged column (e.g.,NA+NA=NA) If a zero (
0) value is incol_nthen the formatted output will be"0"(i.e., no percentage will be shown)
Any resulting NA values in the col_n column following the merge
operation can be easily formatted using sub_missing().
Separate calls of sub_missing() can be used for the col_n and
col_pct columns for finer control of the replacement values. It is the
responsibility of the user to ensure that values are correct in both the
col_n and col_pct columns (this function neither generates nor
recalculates values in either). Formatting of each column can be done
independently in separate fmt_number() and fmt_percent() calls.
This function is part of a set of four column-merging functions. The other
three are the general cols_merge() function and the specialized
cols_merge_uncert() and cols_merge_range() functions. These functions
operate similarly, where the non-target columns can be optionally hidden from
the output table through the hide_columns or autohide options.
Examples
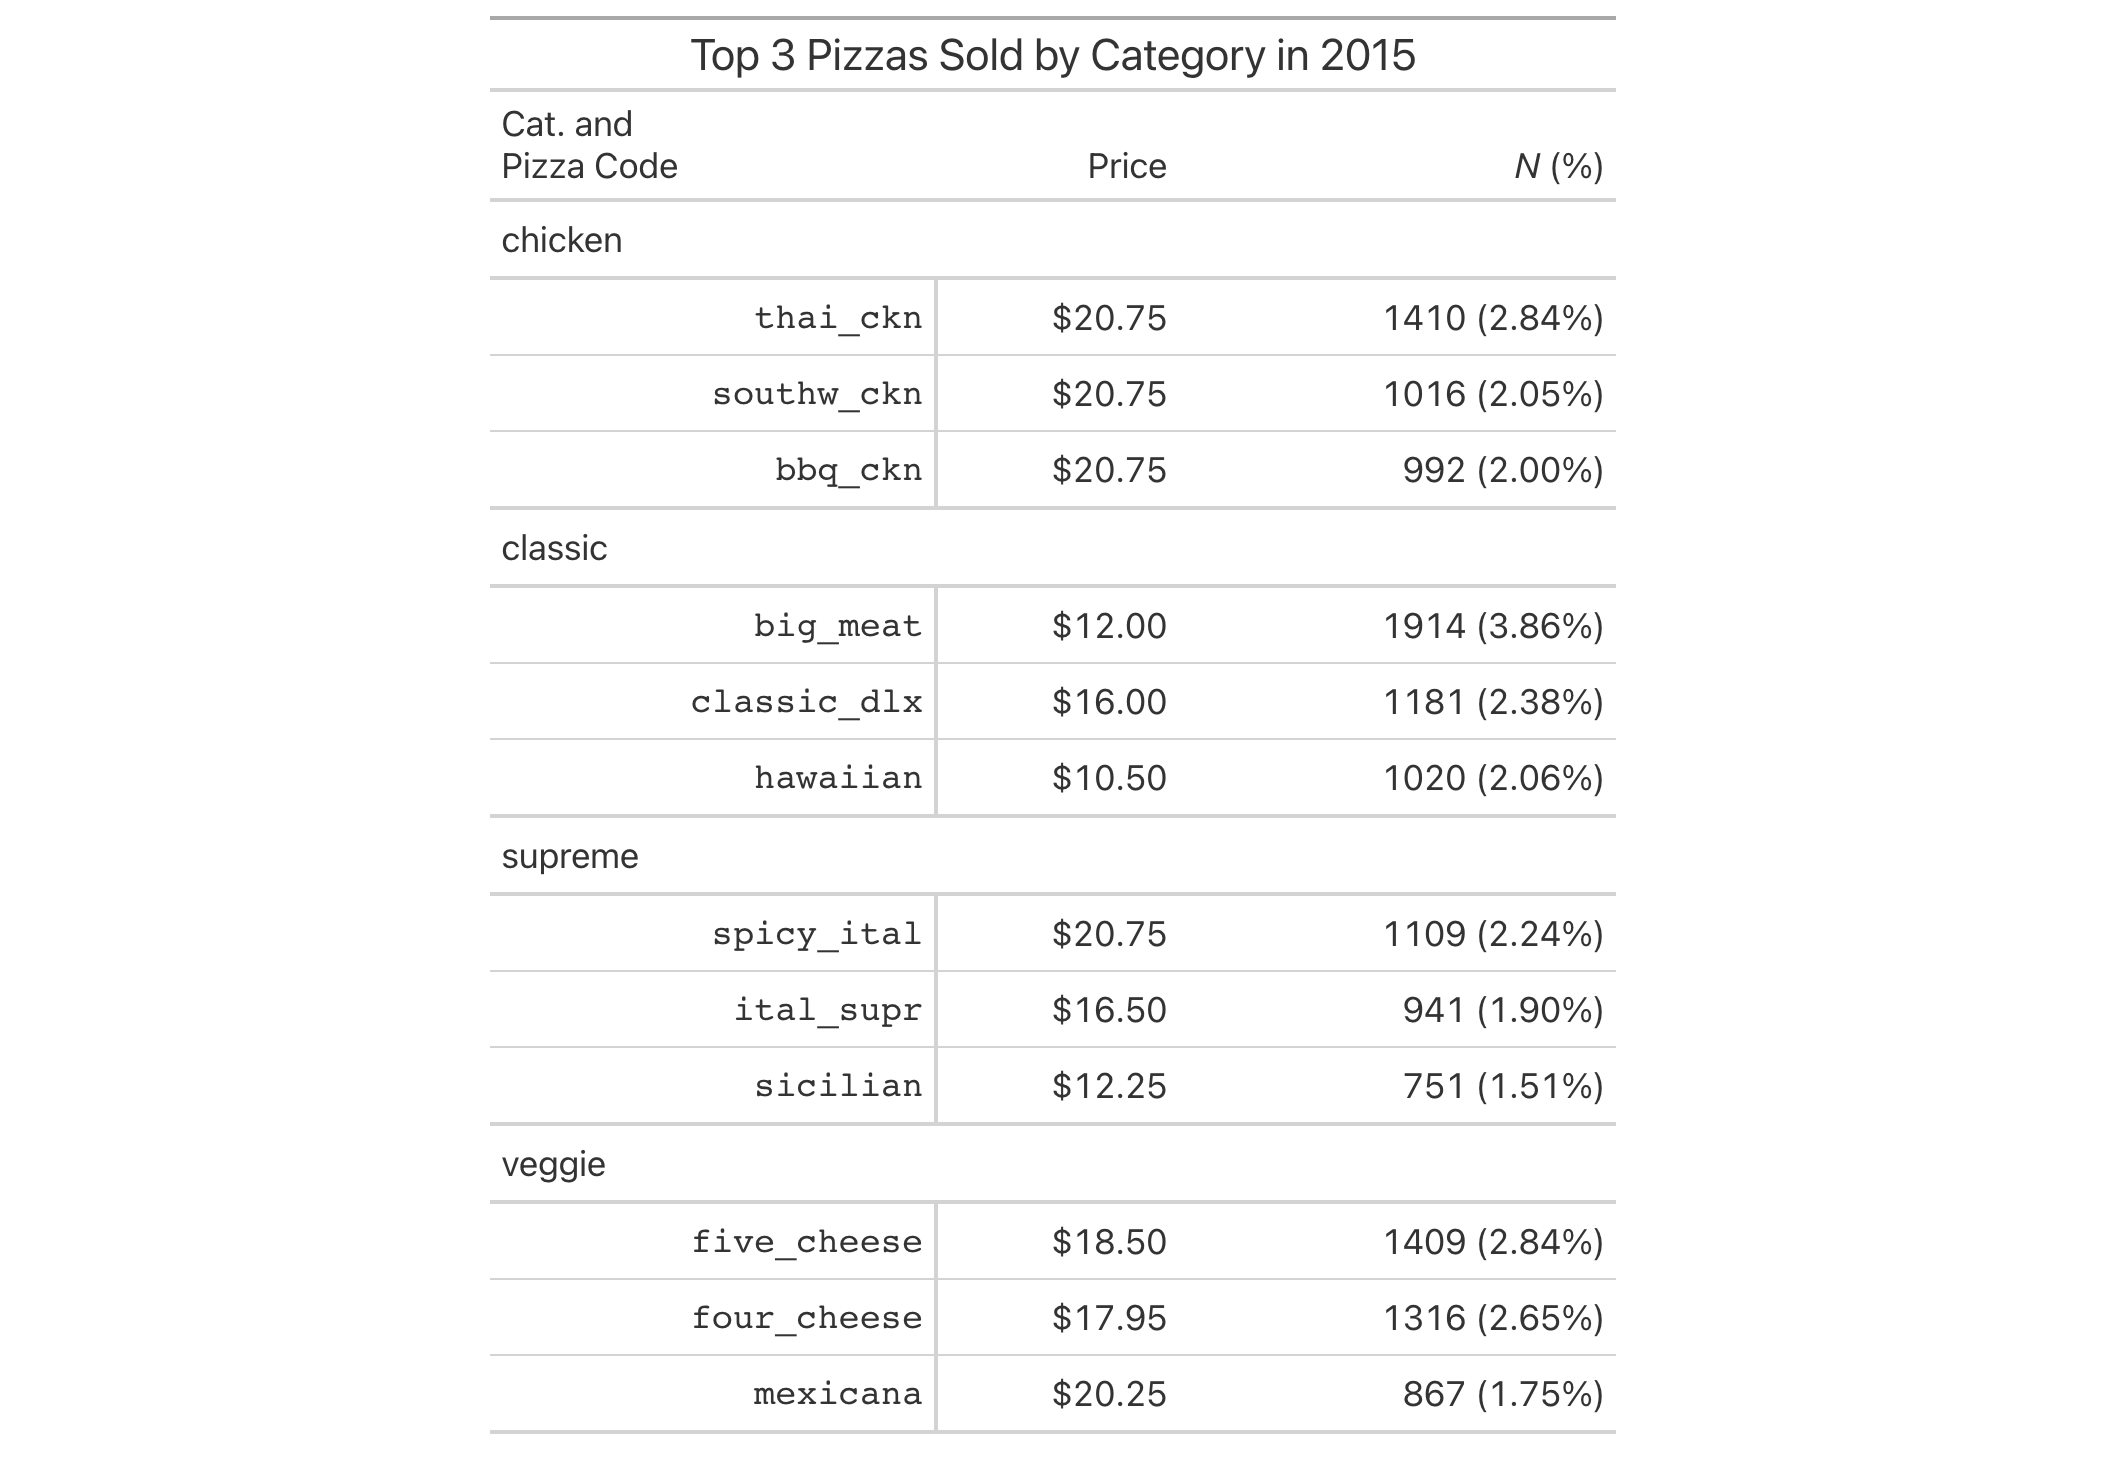
Using a summarized version of the pizzaplace dataset, let's create a
gt table that displays the counts and percentages of the top 3 pizzas
sold by pizza category in 2015. The cols_merge_n_pct() function is used to
merge the n and frac columns (and the frac column is formatted using
fmt_percent()).
pizzaplace |>
  dplyr::group_by(name, type, price) |>
  dplyr::summarize(
    n = dplyr::n(),
    frac = n/nrow(pizzaplace),
    .groups = "drop"
  ) |>
  dplyr::arrange(type, dplyr::desc(n)) |>
  dplyr::group_by(type) |>
  dplyr::slice_head(n = 3) |>
  gt(
    rowname_col = "name",
    groupname_col = "type"
  ) |>
  fmt_currency(price) |>
  fmt_percent(frac) |>
  cols_merge_n_pct(
    col_n = n,
    col_pct = frac
  ) |>
  cols_label(
    n = md("*N* (%)"),
    price = "Price"
  ) |>
  tab_style(
    style = cell_text(font = "monospace"),
    locations = cells_stub()
  ) |>
  tab_stubhead(md("Cat. and  \nPizza Code")) |>
  tab_header(title = "Top 3 Pizzas Sold by Category in 2015") |>
  tab_options(table.width = px(512))
Function ID
5-17
Function Introduced
v0.3.0 (May 12, 2021)
See Also
Other column modification functions:
cols_add(),
cols_align(),
cols_align_decimal(),
cols_hide(),
cols_label(),
cols_label_with(),
cols_merge(),
cols_merge_range(),
cols_merge_uncert(),
cols_move(),
cols_move_to_end(),
cols_move_to_start(),
cols_nanoplot(),
cols_unhide(),
cols_units(),
cols_width()