| par {graphics} | R Documentation |
Set or Query Graphical Parameters
Description
par can be used to set or query graphical parameters.
Parameters can be set by specifying them as arguments to par in
tag = value form, or by passing them as a list of tagged
values.
Usage
par(..., no.readonly = FALSE)

<highlevel plot> (...., <tag> = <value>)
Arguments
... |
arguments in |
no.readonly |
logical; if |
Details
Each device has its own set of graphical parameters. If the current
device is the null device, par will open a new device before
querying/setting parameters. (What device is controlled by
options("device").)
Parameters are queried by giving one or more character vectors of
parameter names to par.
par() (no arguments) or par(no.readonly = TRUE) is used to
get all the graphical parameters (as a named list). Their
names are currently taken from the unexported variable
graphics:::.Pars.
R.O. indicates read-only arguments: These
may only be used in queries and cannot be set. ("cin",
"cra", "csi", "cxy", "din" and
"page" are always read-only.)
Several parameters can only be set by a call to par():
-
"ask", -
"fig","fin", -
"lheight", -
"mai","mar","mex","mfcol","mfrow","mfg", -
"new", -
"oma","omd","omi", -
"pin","plt","ps","pty", -
"usr", -
"xlog","ylog", -
"ylbias"
The remaining parameters can also be set as arguments (often via
...) to high-level plot functions such as
plot.default, plot.window,
points, lines, abline,
axis, title, text,
mtext, segments, symbols,
arrows, polygon, rect,
box, contour, filled.contour
and image. Such settings will be active during the
execution of the function, only. However, see the comments on
bg, cex, col, lty, lwd and
pch which may be taken as arguments to certain plot
functions rather than as graphical parameters.
The meaning of ‘character size’ is not well-defined: this is
set up for the device taking pointsize into account but often
not the actual font family in use. Internally the corresponding pars
(cra, cin, cxy and csi) are used only to
set the inter-line spacing used to convert mar and oma
to physical margins. (The same inter-line spacing multiplied by
lheight is used for multi-line strings in text and
strheight.)
Note that graphical parameters are suggestions: plotting functions and
devices need not make use of them (and this is particularly true of
non-default methods for e.g. plot).
Value
When parameters are set, their previous values are returned in an
invisible named list. Such a list can be passed as an argument to
par to restore the parameter values. Use par(no.readonly
= TRUE) for the full list of parameters that can be restored.
However, restoring all of these is not wise: see the ‘Note’
section.
When just one parameter is queried, the value of that parameter is returned as (atomic) vector. When two or more parameters are queried, their values are returned in a list, with the list names giving the parameters.
Note the inconsistency: setting one parameter returns a list, but querying one parameter returns a vector.
Graphical Parameters
adjThe value of
adjdetermines the way in which text strings are justified intext,mtextandtitle. A value of0produces left-justified text,0.5(the default) centered text and1right-justified text. (Any value in[0, 1]is allowed, and on most devices values outside that interval will also work.)Note that the
adjargument oftextalso allowsadj = c(x, y)for different adjustment in x- and y- directions. Note that whereas fortextit refers to positioning of text about a point, formtextandtitleit controls placement within the plot or device region.annIf set to
FALSE, high-level plotting functions callingplot.defaultdo not annotate the plots they produce with axis titles and overall titles. The default is to do annotation.asklogical. If
TRUE(and the R session is interactive) the user is asked for input, before a new figure is drawn. As this applies to the device, it also affects output by packages grid and lattice. It can be set even on non-screen devices but may have no effect there.This not really a graphics parameter, and its use is deprecated in favour of
devAskNewPage.bgThe color to be used for the background of the device region. When called from
par()it also setsnew = FALSE. See section ‘Color Specification’ for suitable values. For many devices the initial value is set from thebgargument of the device, and for the rest it is normally"white".Note that some graphics functions such as
plot.defaultandpointshave an argument of this name with a different meaning.btyA character string which determined the type of
boxwhich is drawn about plots. Ifbtyis one of"o"(the default),"l","7","c","u", or"]"the resulting box resembles the corresponding upper case letter. A value of"n"suppresses the box.cexA numerical value giving the amount by which plotting text and symbols should be magnified relative to the default. This starts as
1when a device is opened, and is reset when the layout is changed, e.g. by settingmfrow.Note that some graphics functions such as
plot.defaulthave an argument of this name which multiplies this graphical parameter, and some functions such aspointsandtextaccept a vector of values which are recycled.cex.axisThe magnification to be used for axis annotation relative to the current setting of
cex.cex.labThe magnification to be used for x and y labels relative to the current setting of
cex.cex.mainThe magnification to be used for main titles relative to the current setting of
cex.cex.subThe magnification to be used for sub-titles relative to the current setting of
cex.cinR.O.; character size
(width, height)in inches. These are the same measurements ascra, expressed in different units.colA specification for the default plotting color. See section ‘Color Specification’.
Some functions such as
linesandtextaccept a vector of values which are recycled and may be interpreted slightly differently.col.axisThe color to be used for axis annotation. Defaults to
"black".col.labThe color to be used for x and y labels. Defaults to
"black".col.mainThe color to be used for plot main titles. Defaults to
"black".col.subThe color to be used for plot sub-titles. Defaults to
"black".craR.O.; size of default character
(width, height)in ‘rasters’ (pixels). Some devices have no concept of pixels and so assume an arbitrary pixel size, usually 1/72 inch. These are the same measurements ascin, expressed in different units.crtA numerical value specifying (in degrees) how single characters should be rotated. It is unwise to expect values other than multiples of 90 to work. Compare with
srtwhich does string rotation.csiR.O.; height of (default-sized) characters in inches. The same as
par("cin")[2].cxyR.O.; size of default character
(width, height)in user coordinate units.par("cxy")ispar("cin")/par("pin")scaled to user coordinates. Note thatc(strwidth(ch), strheight(ch))for a given stringchis usually much more precise.dinR.O.; the device dimensions,
(width, height), in inches. See alsodev.size, which is updated immediately when an on-screen device windows is re-sized.err(Unimplemented; R is silent when points outside the plot region are not plotted.) The degree of error reporting desired.
familyThe name of a font family for drawing text. The maximum allowed length is 200 bytes. This name gets mapped by each graphics device to a device-specific font description. The default value is
""which means that the default device fonts will be used (and what those are should be listed on the help page for the device). Standard values are"serif","sans"and"mono", and the Hershey font families are also available. (Devices may define others, and some devices will ignore this setting completely. Names starting with"Hershey"are treated specially and should only be used for the built-in Hershey font families.) This can be specified inline fortext.fgThe color to be used for the foreground of plots. This is the default color used for things like axes and boxes around plots. When called from
par()this also sets parametercolto the same value. See section ‘Color Specification’. A few devices have an argument to set the initial value, which is otherwise"black".figA numerical vector of the form
c(x1, x2, y1,
        y2)
which gives the (NDC) coordinates of the figure region in the display region of the device. If you set this, unlike S, you start a new plot, so to add to an existing plot usenew = TRUEas well.finThe figure region dimensions,
(width, height), in inches. If you set this, unlike S, you start a new plot.fontAn integer which specifies which font to use for text. If possible, device drivers arrange so that 1 corresponds to plain text (the default), 2 to bold face, 3 to italic and 4 to bold italic. Also, font 5 is expected to be the symbol font, in Adobe symbol encoding. On some devices font families can be selected by
familyto choose different sets of 5 fonts.font.axisThe font to be used for axis annotation.
font.labThe font to be used for x and y labels.
font.mainThe font to be used for plot main titles.
font.subThe font to be used for plot sub-titles.
labA numerical vector of the form
c(x, y, len)which modifies the default way that axes are annotated. The values ofxandygive the (approximate) number of tickmarks on the x and y axes andlenspecifies the label length. The default isc(5, 5, 7).lenis unimplemented in R.lasnumeric in {0,1,2,3}; the style of axis labels.
- 0:
always parallel to the axis [default],
- 1:
always horizontal,
- 2:
always perpendicular to the axis,
- 3:
always vertical.
Also supported by
mtext. Note that string/character rotation via argumentsrttopardoes not affect the axis labels.lendThe line end style. This can be specified as an integer or string:
0and"round"mean rounded line caps [default];
1and"butt"mean butt line caps;
2and"square"mean square line caps.
lheightThe line height multiplier. The height of a line of text (used to vertically space multi-line text) is found by multiplying the character height both by the current character expansion and by the line height multiplier. Default value is 1. Used in
textandstrheight.ljoinThe line join style. This can be specified as an integer or string:
0and"round"mean rounded line joins [default];
1and"mitre"mean mitred line joins;
2and"bevel"mean bevelled line joins.
lmitreThe line mitre limit. This controls when mitred line joins are automatically converted into bevelled line joins. The value must be larger than 1 and the default is 10. Not all devices will honour this setting.
ltyThe line type. Line types can either be specified as an integer (0=blank, 1=solid (default), 2=dashed, 3=dotted, 4=dotdash, 5=longdash, 6=twodash) or as one of the character strings
"blank","solid","dashed","dotted","dotdash","longdash", or"twodash", where"blank"uses ‘invisible lines’ (i.e., does not draw them).Alternatively, a string of up to 8 characters (from
c(1:9,
        "A":"F")
) may be given, giving the length of line segments which are alternatively drawn and skipped. See section ‘Line Type Specification’.Functions such as
linesandsegmentsaccept a vector of values which are recycled.lwdThe line width, a positive number, defaulting to
1. The interpretation is device-specific, and some devices do not implement line widths less than one. (See the help on the device for details of the interpretation.)Functions such as
linesandsegmentsaccept a vector of values which are recycled: in such uses lines corresponding to valuesNAorNaNare omitted. The interpretation of0is device-specific.maiA numerical vector of the form
c(bottom,
        left, top, right)
which gives the margin size specified in inches.
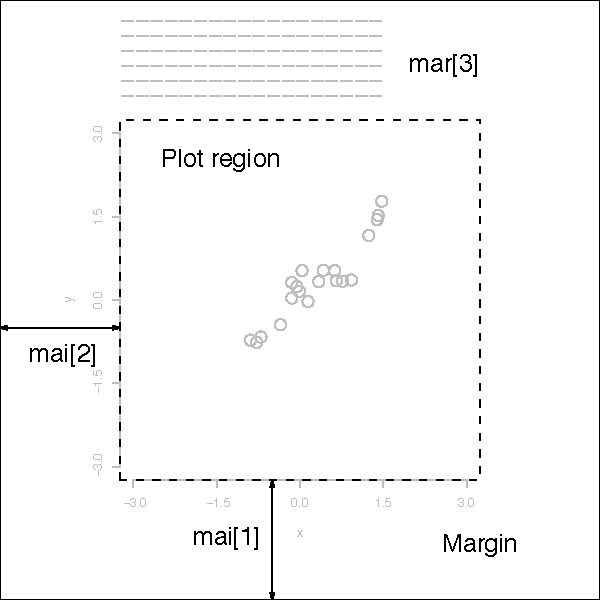
marA numerical vector of the form
c(bottom,
        left, top, right)
which gives the number of lines of margin to be specified on the four sides of the plot. The default isc(5, 4, 4, 2) + 0.1.mex-
mexis a character size expansion factor which is used to describe coordinates in the margins of plots. Note that this does not change the font size, rather specifies the size of font (as a multiple ofcsi) used to convert betweenmarandmai, and betweenomaandomi.This starts as
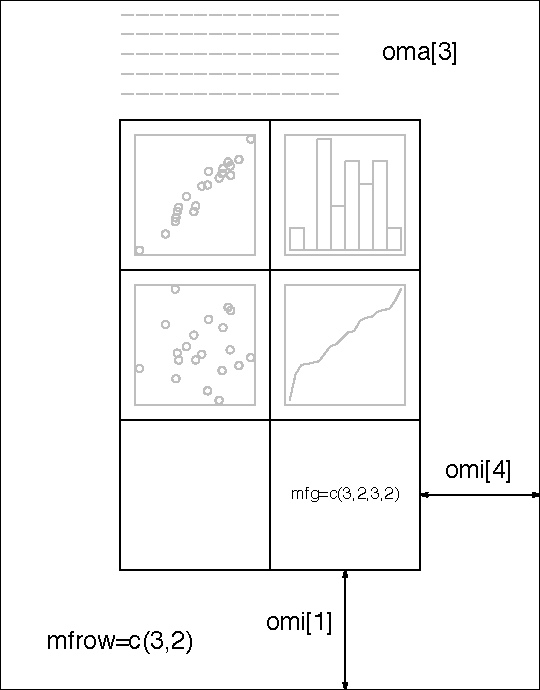
1when the device is opened, and is reset when the layout is changed (alongside resettingcex). mfcol, mfrowA vector of the form
c(nr, nc). Subsequent figures will be drawn in annr-by-ncarray on the device by columns (mfcol), or rows (mfrow), respectively.In a layout with exactly two rows and columns the base value of
"cex"is reduced by a factor of 0.83: if there are three or more of either rows or columns, the reduction factor is 0.66.Setting a layout resets the base value of
cexand that ofmexto1.If either of these is queried it will give the current layout, so querying cannot tell you the order in which the array will be filled.
Consider the alternatives,
layoutandsplit.screen.mfgA numerical vector of the form
c(i, j)whereiandjindicate which figure in an array of figures is to be drawn next (if setting) or is being drawn (if enquiring). The array must already have been set bymfcolormfrow.For compatibility with S, the form
c(i, j, nr, nc)is also accepted, whennrandncshould be the current number of rows and number of columns. Mismatches will be ignored, with a warning.mgpThe margin line (in
mexunits) for the axis title, axis labels and axis line. Note thatmgp[1]affectstitlewhereasmgp[2:3]affectaxis. The default isc(3, 1, 0).mkhThe height in inches of symbols to be drawn when the value of
pchis an integer. Completely ignored in R.newlogical, defaulting to
FALSE. If set toTRUE, the next high-level plotting command (actuallyplot.new) should not clean the frame before drawing as if it were on a new device. It is an error (ignored with a warning) to try to usenew = TRUEon a device that does not currently contain a high-level plot.omaA vector of the form
c(bottom, left, top,
        right)
giving the size of the outer margins in lines of text.
omdA vector of the form
c(x1, x2, y1, y2)giving the region inside outer margins in NDC (= normalized device coordinates), i.e., as a fraction (in[0, 1]) of the device region.omiA vector of the form
c(bottom, left, top,
        right)
giving the size of the outer margins in inches.pageR.O.; A boolean value indicating whether the next call to
plot.newis going to start a new page. This value may beFALSEif there are multiple figures on the page.pchEither an integer specifying a symbol or a single character to be used as the default in plotting points. See
pointsfor possible values and their interpretation. Note that only integers and single-character strings can be set as a graphics parameter (and notNAnorNULL).Some functions such as
pointsaccept a vector of values which are recycled.pinThe current plot dimensions,
(width, height), in inches.pltA vector of the form
c(x1, x2, y1, y2)giving the coordinates of the plot region as fractions of the current figure region.psinteger; the point size of text (but not symbols). Unlike the
pointsizeargument of most devices, this does not change the relationship betweenmarandmai(noromaandomi).What is meant by ‘point size’ is device-specific, but most devices mean a multiple of 1bp, that is 1/72 of an inch.
ptyA character specifying the type of plot region to be used;
"s"generates a square plotting region and"m"generates the maximal plotting region.smo(Unimplemented) a value which indicates how smooth circles and circular arcs should be.
srtThe string rotation in degrees. See the comment about
crt. Only supported bytext.tckThe length of tick marks as a fraction of the smaller of the width or height of the plotting region. If
tck >= 0.5it is interpreted as a fraction of the relevant side, so iftck = 1grid lines are drawn. The default setting (tck = NA) is to usetcl = -0.5.tclThe length of tick marks as a fraction of the height of a line of text. Negative values give tick marks outside the plotting region. The default value is
-0.5; settingtcl = NAsetstck = -0.01which is S' default.usrA vector of the form
c(x1, x2, y1, y2)giving the extremes of the user coordinates of the plotting region. When a logarithmic scale is in use (i.e.,par("xlog")is true, see below), then the x-limits will be10 ^ par("usr")[1:2]. Similarly for the y-axis.xaxpA vector of the form
c(x1, x2, n)giving the coordinates of the extreme tick marks and the number of intervals between tick-marks whenpar("xlog")is false. Otherwise, when log coordinates are active, the three values have a different meaning: For a small range,nis negative, and the ticks are as in the linear case, otherwise,nis in1:3, specifying a case number, andx1andx2are the lowest and highest power of 10 inside the user coordinates,10 ^ par("usr")[1:2]. (The"usr"coordinates are log10-transformed here!)- n = 1
will produce tick marks at
10^jfor integerj,- n = 2
gives marks
k 10^jwithk \in \{1, 5\},- n = 3
gives marks
k 10^jwithk \in \{1, 2, 5\}.
See
axTicks()for a pure R implementation of this.This parameter is reset when a user coordinate system is set up, for example by starting a new page or by calling
plot.windowor settingpar("usr"):nis taken frompar("lab"). It affects the default behaviour of subsequent calls toaxisfor sides 1 or 3.It is only relevant to default numeric axis systems, and not for example to dates.
xaxsThe style of axis interval calculation to be used for the x-axis. Possible values are
"r","i","e","s","d". The styles are generally controlled by the range of data orxlim, if given.
Style"r"(regular) first extends the data range by 4 percent at each end and then finds an axis with pretty labels that fits within the extended range.
Style"i"(internal) just finds an axis with pretty labels that fits within the original data range.
Style"s"(standard) finds an axis with pretty labels within which the original data range fits.
Style"e"(extended) is like style"s", except that it is also ensures that there is room for plotting symbols within the bounding box.
Style"d"(direct) specifies that the current axis should be used on subsequent plots.
(Only"r"and"i"styles have been implemented in R.)xaxtA character which specifies the x axis type. Specifying
"n"suppresses plotting of the axis. The standard value is"s": for compatibility with S values"l"and"t"are accepted but are equivalent to"s": any value other than"n"implies plotting.xlogA logical value (see
loginplot.default). IfTRUE, a logarithmic scale is in use (e.g., afterplot(*, log = "x")). For a new device, it defaults toFALSE, i.e., linear scale.xpdA logical value or
NA. IfFALSE, all plotting is clipped to the plot region, ifTRUE, all plotting is clipped to the figure region, and ifNA, all plotting is clipped to the device region. See alsoclip.yaxpA vector of the form
c(y1, y2, n)giving the coordinates of the extreme tick marks and the number of intervals between tick-marks unless for log coordinates, seexaxpabove.yaxsThe style of axis interval calculation to be used for the y-axis. See
xaxsabove.yaxtA character which specifies the y axis type. Specifying
"n"suppresses plotting.ylbiasA positive real value used in the positioning of text in the margins by
axisandmtext. The default is in principle device-specific, but currently0.2for all of R's own devices. Set this to0.2for compatibility with R < 2.14.0 onx11andwindows()devices.ylogA logical value; see
xlogabove.
Color Specification
Colors can be specified in several different ways. The simplest way is
with a character string giving the color name (e.g., "red"). A
list of the possible colors can be obtained with the function
colors. Alternatively, colors can be specified directly
in terms of their RGB components with a string of the form
"#RRGGBB" where each of the pairs RR, GG,
BB consist of two hexadecimal digits giving a value in the
range 00 to FF. Hexadecimal colors can be in the long
hexadecimal form (e.g., "#rrggbb" or "#rrggbbaa") or the
short form (e.g, "#rgb" or "#rgba"). The short form is
expanded to the long form by replicating digits (not by adding zeroes),
e.g., "#rgb" becomes "#rrggbb". Colors can
also be specified by giving an index into a small table of colors, the
palette: indices wrap round so with the default palette
of size 8, 10 is the same as 2. This provides
compatibility with S. Index 0 corresponds to the background
color. Note that the palette (apart from 0 which is per-device)
is a per-session setting.
Negative integer colours are errors.
Additionally, "transparent" is transparent, useful for
filled areas (such as the background!), and just invisible for things
like lines or text. In most circumstances (integer) NA
is equivalent to "transparent" (but not for
text and mtext).
Semi-transparent colors are available for use on devices that support them.
The functions rgb, hsv, hcl,
gray and rainbow provide additional ways
of generating colors.
Line Type Specification
Line types can either be specified by giving an index into a small
built-in table of line types (1 = solid, 2 = dashed, etc, see
lty above) or directly as the lengths of on/off stretches of
line. This is done with a string of an even number (up to eight)
of characters, namely non-zero
(hexadecimal) digits which give the lengths in consecutive positions
in the string. For example, the string "33" specifies three
units on followed by three off and "3313" specifies three units
on followed by three off followed by one on and finally three off.
The ‘units’ here are (on most devices) proportional to
lwd, and with lwd = 1 are in pixels or points or 1/96
inch.
The five standard dash-dot line types (lty = 2:6) correspond to
c("44", "13", "1343", "73", "2262").
Note that NA is not a valid value for lty.
Note
The effect of restoring all the (settable) graphics parameters as
in the examples is hard to predict if the device has been resized.
Several of them are attempting to set the same things in different
ways, and those last in the alphabet will win. In particular, the
settings of mai, mar, pin, plt and
pty interact, as do the outer margin settings, the figure
layout and figure region size.
References
Becker RA, Chambers JM, Wilks AR (1988). The New S Language. Chapman and Hall/CRC, London. ISBN 053409192X.
Murrell P (2005). R Graphics, series Chapman & Hall/CRC The R Series. CRC Press. ISBN 9781420035025.
See Also
plot.default for some high-level plotting parameters;
colors; clip;
options for other setup parameters;
graphic devices x11, pdf,
postscript and setting up device regions by
layout and split.screen.
Examples
op <- par(mfrow = c(2, 2), # 2 x 2 pictures on one plot
          pty = "s")       # square plotting region,
                           # independent of device size

## At end of plotting, reset to previous settings:
par(op)

## Alternatively,
op <- par(no.readonly = TRUE) # the whole list of settable par's.
## do lots of plotting and par(.) calls, then reset:
par(op)
## Note this is not in general good practice

par("ylog") # FALSE
plot(1 : 12, log = "y")
par("ylog") # TRUE

plot(1:2, xaxs = "i") # 'inner axis' w/o extra space
par(c("usr", "xaxp"))

( nr.prof <-
c(prof.pilots = 16, lawyers = 11, farmers = 10, salesmen = 9, physicians = 9,
  mechanics = 6, policemen = 6, managers = 6, engineers = 5, teachers = 4,
  housewives = 3, students = 3, armed.forces = 1))
par(las = 3)
barplot(rbind(nr.prof)) # R 0.63.2: shows alignment problem
par(las = 0)  # reset to default

require(grDevices) # for gray
## 'fg' use:
plot(1:12, type = "b", main = "'fg' : axes, ticks and box in gray",
     fg = gray(0.7), bty = "7" , sub = R.version.string)

ex <- function() {
   old.par <- par(no.readonly = TRUE) # all par settings which
                                      # could be changed.
   on.exit(par(old.par))
   ## ...
   ## ... do lots of par() settings and plots
   ## ...
   invisible() #-- now,  par(old.par)  will be executed
}
ex()

## Line types
showLty <- function(ltys, xoff = 0, ...) {
   stopifnot((n <- length(ltys)) >= 1)
   op <- par(mar = rep(.5,4)); on.exit(par(op))
   plot(0:1, 0:1, type = "n", axes = FALSE, ann = FALSE)
   y <- (n:1)/(n+1)
   clty <- as.character(ltys)
   mytext <- function(x, y, txt)
      text(x, y, txt, adj = c(0, -.3), cex = 0.8, ...)
   abline(h = y, lty = ltys, ...); mytext(xoff, y, clty)
   y <- y - 1/(3*(n+1))
   abline(h = y, lty = ltys, lwd = 2, ...)
   mytext(1/8+xoff, y, paste(clty," lwd = 2"))
}
showLty(c("solid", "dashed", "dotted", "dotdash", "longdash", "twodash"))
par(new = TRUE)  # the same:
showLty(c("solid", "44", "13", "1343", "73", "2262"), xoff = .2, col = 2)
showLty(c("11", "22", "33", "44",   "12", "13", "14",   "21", "31"))