| summarizor {flextable} | R Documentation |
Data summary preparation
Description
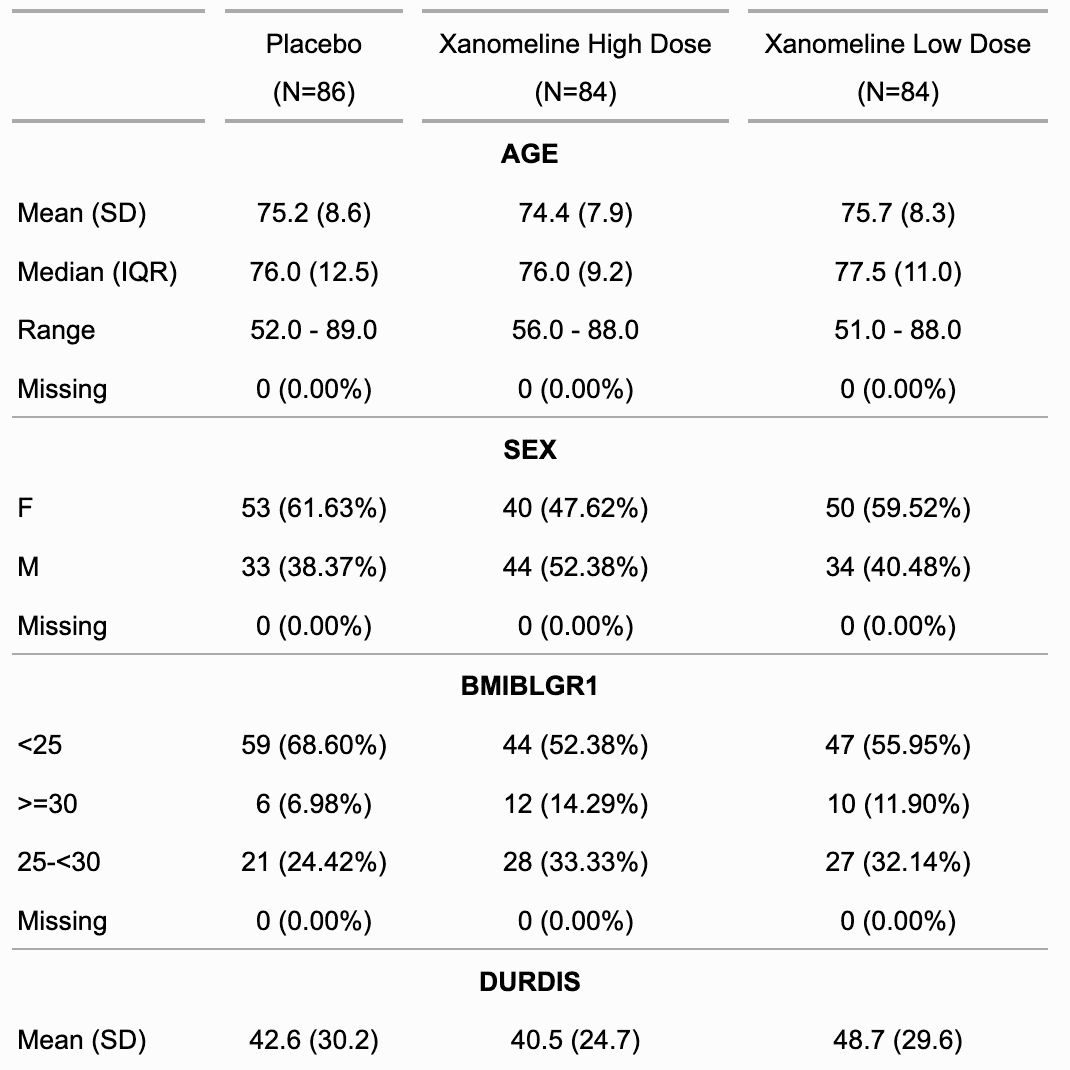
It performs a univariate statistical analysis of a dataset
by group and formats the results so that they can be used with
the tabulator() function or directly with as_flextable.
Usage
summarizor(
  x,
  by = character(),
  overall_label = NULL,
  num_stats = c("mean_sd", "median_iqr", "range"),
  hide_null_na = TRUE
)
Arguments
x |
dataset |
by |
columns names to be used as grouping columns |
overall_label |
label to use as overall label |
num_stats |
available statistics for numerical columns to show, available options are "mean_sd", "median_iqr" and "range". |
hide_null_na |
if TRUE (default), NA counts will not be shown when 0. |
Note
This is very first version of the function; be aware it can evolve or change.
See Also
Examples
z <- summarizor(CO2[-c(1, 4)],
  by = "Treatment",
  overall_label = "Overall"
)
ft_1 <- as_flextable(z)
ft_1

ft_2 <- as_flextable(z, sep_w = 0, spread_first_col = TRUE)
ft_2

z <- summarizor(CO2[-c(1, 4)])
ft_3 <- as_flextable(z, sep_w = 0, spread_first_col = TRUE)
ft_3
[Package flextable version 0.9.6 Index]