| upgrain.threshold {downscale} | R Documentation |
Exploration of trade-offs in threshold selection for upgraining
Description
Explores the NoData threshold selection for upgraining whilst keeping a constant extent across scales. The thresholds are the quantity of unsampled cells at the atlas scale allowed within each cell at the largest grain size. A low threshold means that many unsampled cells will be assigned as absences, whereas a high threshold will mean that many sampled cells and many presence records will be excluded. These trade-offs are plotted, and four possible threshold choices are suggested and their maps presented.
Usage
upgrain.threshold(atlas.data, cell.width = NULL, scales,
                  thresholds = seq(0, 1, 0.01), plot = TRUE)
Arguments
atlas.data |
either a raster file of presence-absence; a spatial points object of class sf where the data frame contains a single column of presence (1) and absences (0); or a data frame of sampled cells, which must contain columns named 'x', 'y' and 'presence'. |
cell.width |
if data is a data frame or sf spatial points object, the cell widths of sampled cells. If data is a raster then leave as default ( |
scales |
the number of cells to upgrain. Upgraining will happen by factors of 2 - ie if scales = 3, the atlas data will be aggregated in 2x2 cells, 4x4 cells and 8x8 cells. |
thresholds |
a vector of thresholds between and including 0 and 1 for the quantity of unsampled NA cells that can be included. |
plot |
Two sets of four plots (hit return to see the next set). Default = TRUE. |
Details
A more detailed description is available at vignette("Upgraining", package = "downscale").
In order to downscale we need to upgrain our atlas data across several scales. However, if the atlas data is not rectangular, as we aggregate cells during upgraining then the extent also increases.
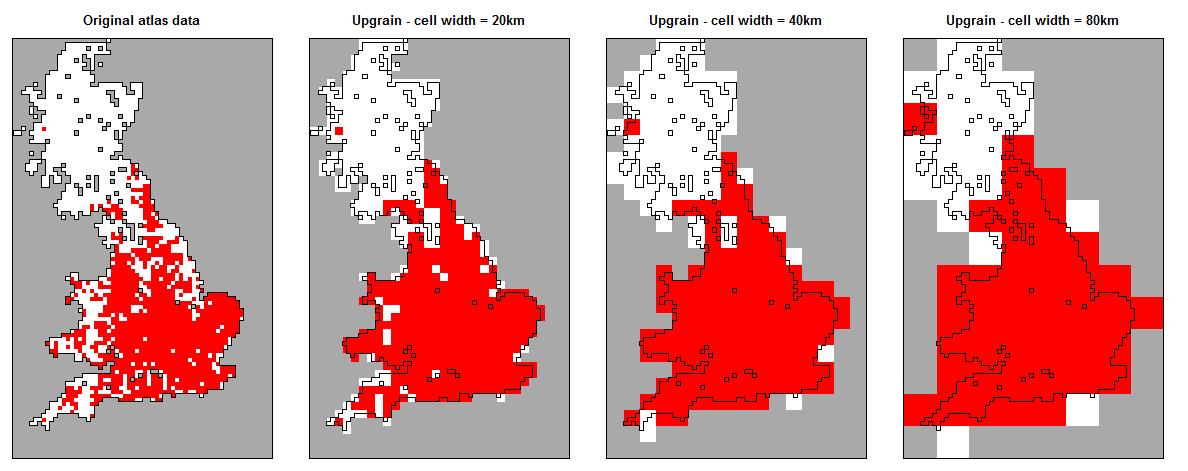
Instead we must ensure the extent is constant across all scales by fixing the extent at all grain sizes to the extent of the largest grain size and convert our proportion of occupied cells back to area of occupancy by using the standardised extent (not the original atlas data extent).
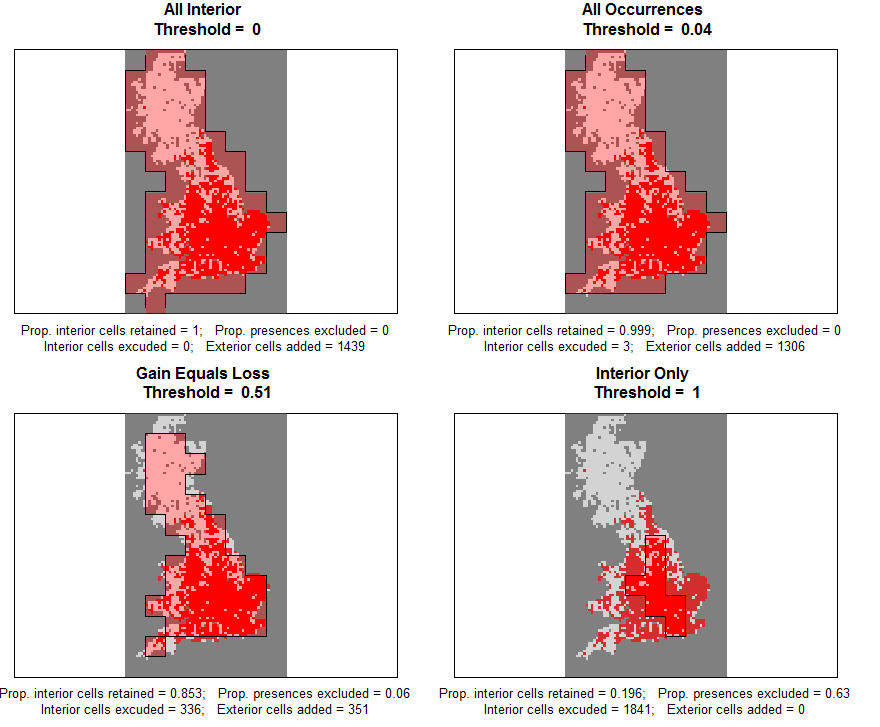
However, if we fix the extent there is trade-off between assigning large areas of unsampled areas as absence, and discarding sampled areas and known Occurrences. The upgrain.threshold function allows visualisations of this trade-off at the atlas scale through four plots:
| a) | The total standardised extent; | |
| b) | The number of unsampled cells added and assigned as absences, and the number of sampled cells excluded and assigned as No Data; | |
| c) | The proportion of the original atlas data retained; | |
| d) | The proportion of known Occurrences excluded. | |
The final choice of threshold is up to the user on a case-by-case basis but we propose four threshold criteria in this function:
| Threshold | Method | Description | |
| 0 | All_Sampled | All of the original atlas data is included. | |
| Species specific | All_Occurrences | The threshold where no occurrences in the atlas data are excluded. | |
| Atlas specific | Gain_Equals_Loss | The threshold where the number of sampled atlas cells reclassified as No Data equals the number of unsampled exterior cells reclassified as absence. In this threshold the new standardised extent also equals the extent of the original atlas data. | |
| 1 | Sampled_Only | Only cells that contain 100% sampled atlas data are included. | |
The function also creates maps for each of these four thresholds. In the example case this clearly demonstrates the trade-off between generating assumptions about unsampled areas, and losing data (and Occurrences) for the sampled atlas data.
Value
Returns a list contatining two objects:
Thresholds |
the threshold values for the four default threshold selections. | |||||||||||||||||||
Data |
Data frame containing six columns:
|
Author(s)
Charles Marsh <charlie.marsh@mailbox.org>
References
Groom, Q., Marsh, C.J., Gavish, Y. Kunin, W.E. (2018). How to predict fine resolution occupancy from coarse occupancy data, Methods in Ecology and Evolution. 9(11), 2273-2284.
Marsh, C.J, Barwell, L.J., Gavish, Y., Kunin, W.E. (2018). downscale: An R package for downscaling species occupancy from coarse-grain data to predict occupancy at fine-grain sizes, Journal of Statistical Software 86(Code Snippet 3), 1-20.
Marsh, C.J, Gavish, Y., Kunin, W.E., Brummitt N.A. (2019). Mind the gap: Can downscaling Area of Occupancy overcome sampling gaps when assessing IUCN Red List status?, Diversity and Distributions 25, 1832-1845.
Examples
## example species data
data.file <- system.file("extdata", "atlas_data.txt", package = "downscale")
atlas.data <- read.table(data.file, header = TRUE)

## if the input data is a data frame it must have the columns "x", "y"
## and "presence"
head(atlas.data)

thresh <- upgrain.threshold(atlas.data = atlas.data,
                            cell.width = 10,
                            scales = 3,
                            thresholds = seq(0, 1, 0.02))

## the four optional thresholds
thresh$Thresholds
head(thresh$Data)