| upgrain {downscale} | R Documentation |
Upgraining of atlas data to larger grain sizes
Description
Takes presence-absence atlas data and aggregates data to larger grain sizes, returning occupancy at each grain size for use in downscale modelling. Atlas data may be in the form of raster data or as a data frame with presence-absence information and cell coordinates.
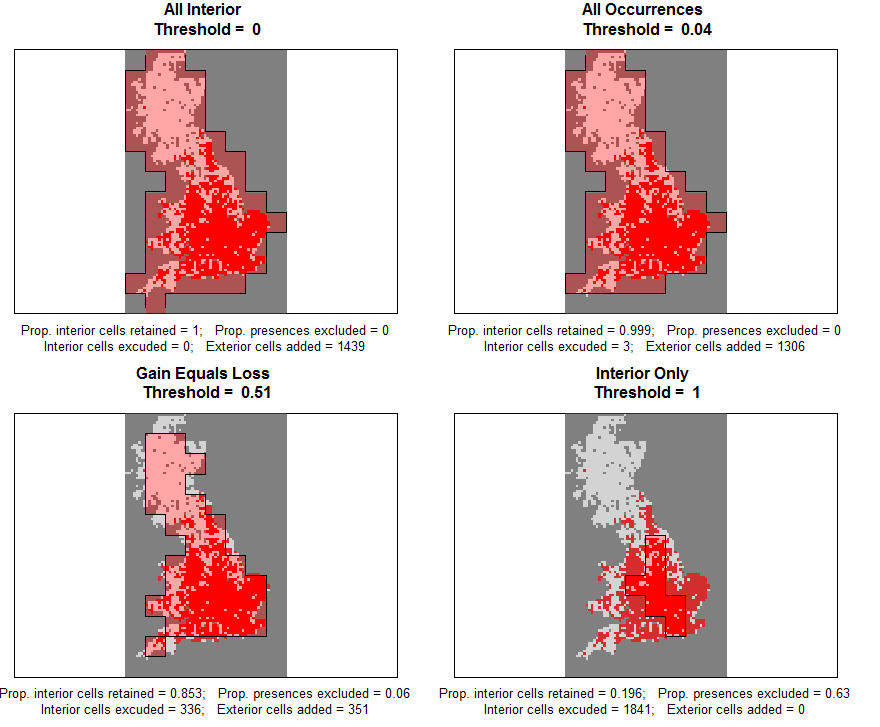
The extent for all scales is standardised to that of the largest grain size by applying a threshold for the proportion of unsampled atlas cells allowed within a cell at the largest grain size. The threshold can be chosen by the user or one of four threshold selections methods apply. See upgrain.threshold for a visualisation of the thresholds.
The function outputs a data frame of occupancies suitable as input for downscale, and will also plot the original atlas data along with the standardised data for each upgrained scale. In all plots presence = red, absence = white, and NA = grey.
Usage
upgrain(atlas.data, cell.width = NULL, scales, threshold = NULL,
        method = "All_Sampled", plot = TRUE, return.rasters = FALSE)
Arguments
atlas.data |
either a raster file of presence-absence; a spatial points object of class sf where the data frame contains a single column of presence (1) and absences (0); or a data frame of sampled cells, which must contain columns named 'x', 'y' and 'presence'. |
cell.width |
if data is a data frame or sf spatial points object, the cell widths of sampled cells. If data is a raster then leave as default ( |
scales |
the number of cells to upgrain. Upgraining will happen by factors of 2 - ie if scales = 3, the atlas data will be aggregated in 2x2 cells, 4x4 cells and 8x8 cells. |
threshold |
default = |
method |
one of |
plot |
default = |
return.rasters |
default = |
Details
When aggregating data to larger grain sizes, the extent of all grain sizes is set to the extent of the largest grain size. At the atlas scale, unsampled NA cells that fall within this extent are assigned as absences. This ensures that there are subsequently equal extents across all scales and therefore consistency of occupancy estimates. Therefore, it is necessary to apply a threshold whereby only those cells at the largest grain size are retained if a certain proportion of them are sampled at the altas scale. However, there is a trade-off between assigning unsampled cells as absences, and discarding sampled cells and presences.
It is highly advisable before selecting a threshold to explore this trade-off on a case-by-case basis with upgrain.threshold and to read the help file therein as well as referring to vignette("Upgraining", package = "downscale").
The user may input their own threshold or use one of four suggested threshold criteria:
| Threshold | Method | Description | |
| 0 | All_Sampled | All of the original atlas data is included. | |
| Species specific | All_Occurrences | The threshold where no occurrences in the atlas data are excluded. | |
| Atlas specific | Gain_Equals_Loss | The threshold where the number of sampled atlas cells reclassified as No Data equals the number of unsampled exterior cells reclassified as absence. In this threshold the new standardised extent also equals the extent of the original atlas data. | |
| 1 | Sampled_Only | Only cells that contain 100% sampled atlas data are included. | |

Value
Returns a list of class "upgrain" that can be used as a direct input to downscale and hui.downscale. The list contains five objects:
threshold |
The proportion of unsampled atlas cells allowed within a cell at the largest grain size, either defined by the user through | ||||||||||
extent.stand |
The standardised extent after upgraining (equal to the extent of the largest grain size) | ||||||||||
occupancy.stand |
Occupancy for each grain size where extent has been standardised. The data frame contains three columns:
| ||||||||||
occupancy.orig |
Original occupancies for each grain size before extent has been standardised. The data frame contains three columns:
| ||||||||||
atlas.raster.stand |
A raster layer of the extent-standardised atlas data | ||||||||||
scaled.rasters |
If |
Author(s)
Charles Marsh <charlie.marsh@mailbox.org>
References
Groom, Q., Marsh, C.J., Gavish, Y. Kunin, W.E. (2018). How to predict fine resolution occupancy from coarse occupancy data, Methods in Ecology and Evolution. 9(11), 2273-2284.
Marsh, C.J, Barwell, L.J., Gavish, Y., Kunin, W.E. (2018). downscale: An R package for downscaling species occupancy from coarse-grain data to predict occupancy at fine-grain sizes, Journal of Statistical Software 86(Code Snippet 3), 1-20.
Marsh, C.J, Gavish, Y., Kunin, W.E., Brummitt N.A. (2019). Mind the gap: Can downscaling Area of Occupancy overcome sampling gaps when assessing IUCN Red List status?, Diversity and Distributions 25, 1832-1845.
Examples
## example species data
data.file <- system.file("extdata", "atlas_data.txt", package = "downscale")
atlas.data <- read.table(data.file, header = TRUE)

## if the input data is a data frame it must have the columns "x", "y"
## and "presence"
head(atlas.data)

## explore thresholds using upgrain.threshold
thresh <- upgrain.threshold(atlas.data = atlas.data,
                            cell.width = 10,
                            scales = 3,
                            thresholds = seq(0, 1, 0.1))

## use a specified threshold - method must equal NULL
upgrain(atlas.data = atlas.data,
        cell.width= 10,
        scales = 3,
        threshold = 0.15,
        method = NULL)

## use one of the suggested methods - do not specify a threshold
all_sampled <- upgrain(atlas.data = atlas.data,
                       cell.width= 10,
                       scales = 3,
                       method = "All_Sampled")


## input data for downscale for All Sampled threshold
all_sampled$occupancy.stand

## and the original occupancies (note that extent varies with scale)
all_sampled$occupancy.orig

## if data is an sf spatial points object
presence <- data.frame(presence = atlas.data$presence)
spdf <- sf::st_as_sf(atlas.data, coords = c("x", "y"))

all_sampled <- upgrain(atlas.data = spdf,
                       cell.width= 10,
                       scales = 3,
                       method = "All_Sampled")